This article aims to provide the information required to create custom reports using the WSO2 Identity Server Analytics tool.
For this purpose, details on WSO2 Identity Server Analytics initialization are provided, as well as information on how to create an external data source for WSO2 IS Analytics.
Prerequisites for Initializing WSO2 IS Analytics and Creating Custom Reports
To correctly initialize the analytics tool, the following steps must be taken:
1. Enable Analytics in WSO2 IS
The first step in this process is the editing of the dentity.xml file found in the <WSO2IS_HOME>/repository/conf/identity/ path. The following listeners are activated here:
| Listener | org.wso2.carbon.identity.data.publisher.application.authentication.AuthnDataPublisherProxy |
| Purpose | This listener is necessary to enable both session and login analytics. |
| Setting | <EventListener type=”org.wso2.carbon.identity.core.handler.AbstractIdentityMessageHandler”
name=”org.wso2.carbon.identity.data.publisher.application.authentication.AuthnDataPublisherProxy” orderId=”11″ enable=”true”/> |
| Listener | org.wso2.carbon.identity.data.publisher.application.authentication.impl.DASLoginDataPublisherImpl |
| Purpose | This listener should only be enabled if you wish to analyze statistics relating to attempted logins via WSO2 IS. |
| Setting | <EventListener type=”org.wso2.carbon.identity.core.handler.AbstractIdentityMessageHandler”
name=”org.wso2.carbon.identity.data.publisher.application.authentication.impl.DASLoginDataPublisherImpl” orderId=”10″ enable=”true”/> |
| Listener | org.wso2.carbon.identity.data.publisher.application.authentication.impl.DASSessionDataPublisherImpl |
| Purpose | This listener should only be enabled if you wish to analyze session-specific statistics for WSO2 IS Analytics. |
| Setting |
<EventListener type=”org.wso2.carbon.identity.core.handler.AbstractIdentityMessageHandler” name=”org.wso2.carbon.identity.data.publisher.application.authentication.impl.DASSessionDataPublisherImpl” orderId=”11″ enable=”true”/> |
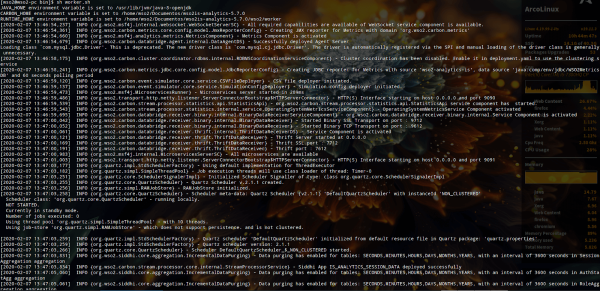
2. Initialize the Worker Node
To initialize the Worker Node, go to the <WSO2IS-ANALYTICS_HOME>/bin/ path.
Run the following command:
On Windows: worker.bat
On Linux: ./worker.sh
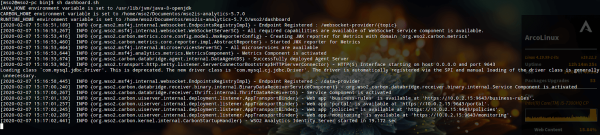
3. Initialize the Dashboard Node
To run the Dashboard Node, go to the <WSO2IS-ANALYTICS_HOME>/bin/ path.
Run the following command:
On Windows: dashboard.bat
On Linux: ./dashboard.sh
4. Creating an External Data Source
The new data source should be added to the so2.datasources fragment. This is located in the deployment.yaml file, which can be found in the <ISA_HOME>/conf/dashboard/ path. It must include the following information:
| Parameter | Description |
| name | Data source name. Example: WSO2EVENTUSER |
| description | Brief comment on the data source. |
| JndiConfig | |
| name | Name by which the jndi is identified. Example: jdbc/WSO2EVENTUSER |
| definition | |
| type | Type of database. Example: RDBMS |
| configuration | |
| jdbcUrl | URL where the database is hosted. Example: jdbc:mysql:/{/LOCALHOST}:{PORT}/WSO2EVENTUSER?useSSL=false |
| username | Database username. Example: root |
| Password | Database user password. Example: root |
| driverClassName | Driver class used for connecting to the database. Example: com.mysql.jdbc.Driver |
| maxPoolSize | Maximum number of connections permitted. Example: 50 |
| idleTimeout | Wait time for inactive sessions in milliseconds. Example: 60000 |
| validationTimeout | Wait time for resource validation in milliseconds. Example: 30000 |
| isAutoCommit | Each and every statement through the connection will be run via a separate and implicit transaction. Example: false |
    description: "The data source used for WSO2 IS Analytics statistics"
    jndiConfig:
      name: jdbc/WSO2EVENTUSER
    definition:
      type: RDBMS
      configuration:
        jdbcUrl: 'jdbc:mysql://{LOCALHOST}:{PORT}/WSO2EVENTUSER?useSSL=false'
        username: root
        password: root
        driverClassName: com.mysql.jdbc.Driver
        maxPoolSize: 50
        idleTimeout: 60000
        validationTimeout: 30000
        isAutoCommit: false</code data-language="yaml">
The Dashboard Node service must be restarted to complete the process.
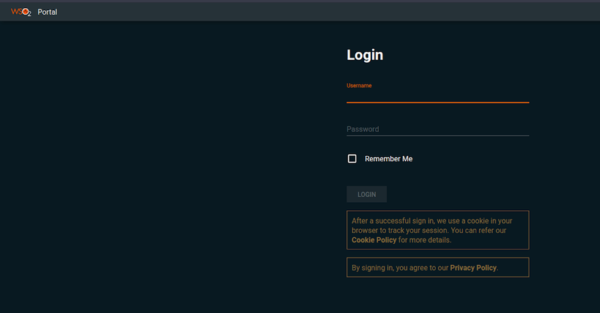
Go to the https://localhost:9643/portal/ URL to log in to the Analytics portal.
Enter the user credentials, which by default are:
User name: admin
Password: admin
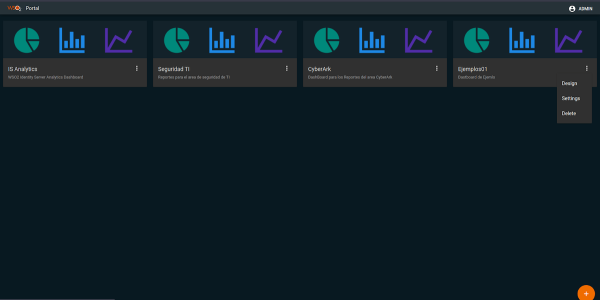
Once inside the portal, the configured dashboards and the options for creating widgets and dashboards will be shown.
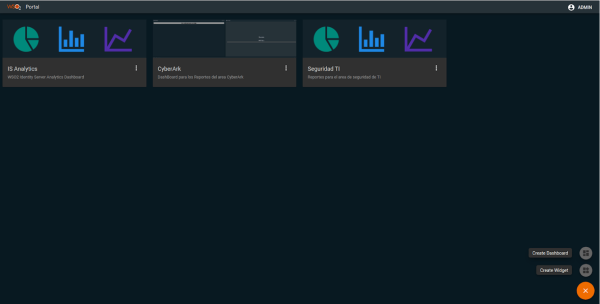
5. Creating a Widget
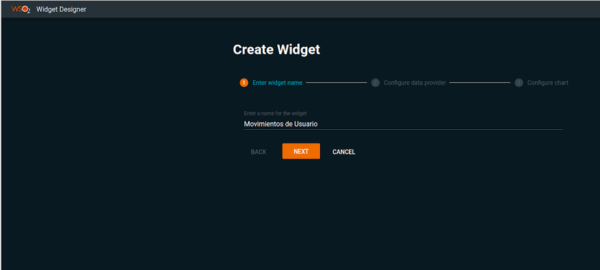
Click on Create Widget to create a new widget. You will be asked to assign a name to it.
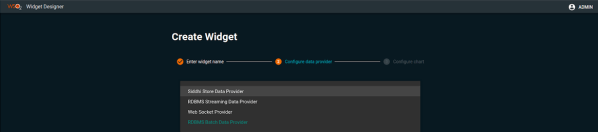
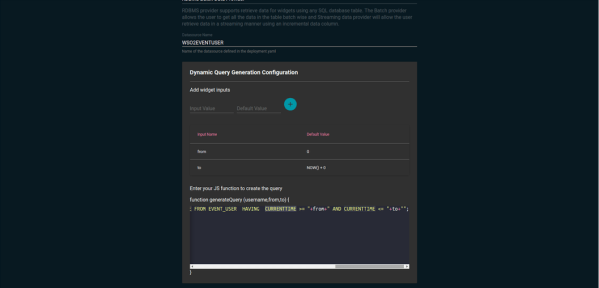
A list of options that WSO2 IS Analytics manages by default will then appear, in this case RDBMS Batch Data Provider is used as an example.
Continuing with this step, you will be asked for the following data:
| Parameter | Value |
| Data source name, found in the deployment.yaml file, in the <ISA_HOME>/conf/dashboard/ path. | WSO2EVENTUSER |
| The query through which information for the custom reports will be obtained. | SELECT * FROM EVENT_USER |
As additional data, you can create a query with parameters. In order to do so, you must define the default values the parameters will have, as shown in the previous image.
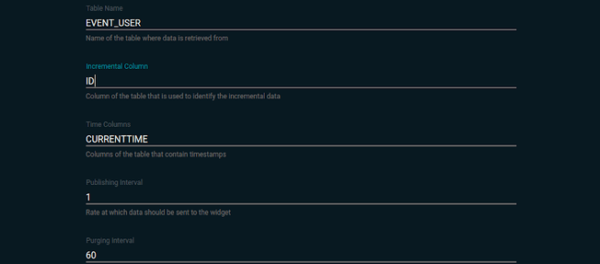
Next, you will be asked for information regarding the table to which the query relates, such as:
| Parameters | Description |
| Table Name | The name of the table.Example: EVENT_USER |
| Incremental Column | Column with incremental data.Example: ID |
| Time Columns | Column that includes the date in long format. |
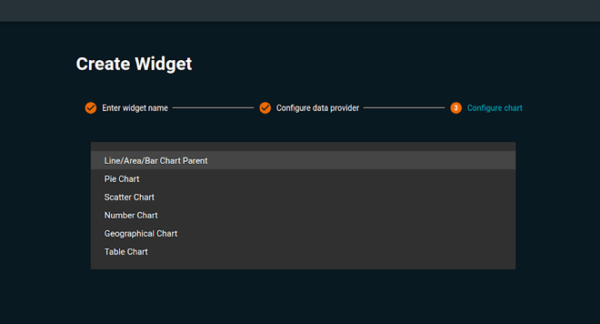
Once this step is completed, click NEXT.
A list of the various custom reports that can be created on the tool will then be shown. By way of example, the TABLE CHART option will be selected.
Here the columns used in the query that was input in previous steps will be shown. You can configure the following actions in these columns:
| Parameter | Description |
| Select Column | If you wish to see the column in the custom reports. |
| Enable Color Based Categorization | If you want to group cells together in the same color. |
| Title of the Column | Column title you wish to include on the custom report. |
| Time formatting regex if the column contains time series data | Regex that defines the column date format Example: %d/%m/%Y %H:%M:%S |
| Color of Text in Cell | Define the color desired for cell text. |
| Color set to use in the charts | Define the color desired for a group of cells. |
| If certain categories are required to be grouped in a certain color | Define the group of cells you wish to apply a previously defined color to. |
Next, a series of options will appear regarding the table generated for the custom report, which define the following aspects in order:
- Maximum number of rows you can handle in a table.
- If you wish to handle table paging.
- If you wish for the table to filter its information.
- If you wish for the table to cover the rows defined in the previous step. Not recommended.

In order to confirm that the settings are correct, click the PREVIEW button.

Once the settings are ready, click CREATE to generate the custom report.
6. Creating a Dashboard
Once you have a new Widget, you can create a new Dashboard. Just as when creating a new Widget, click on the CREATE DASHBOARD option on the portal home page.
You will see a form that asks for the following information:
| Parameter | Description |
| Name of your Dashboard | Name of the new Dashboard. |
| URL | Name of the Dashboard in lower case and without spaces. |
| Description | Brief comment on the functionality or the area the report covers. |
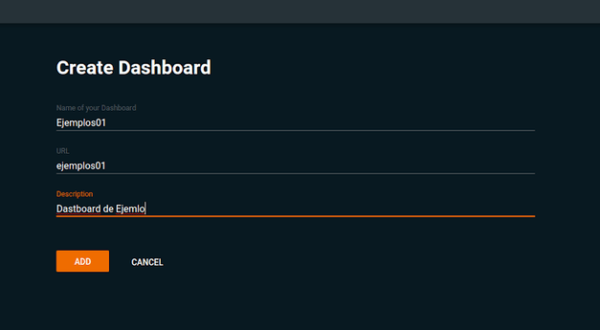
Once the form is complete, click on the ADD button to create a new Dashboard.
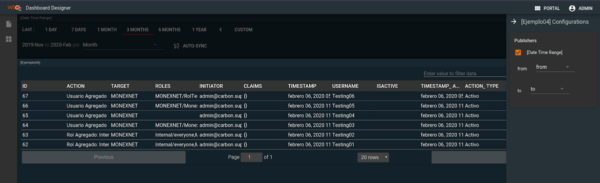
You will then be redirected to the portal home page, where you will select the new Dashboard in the Design form.
It will show the workspace where the reports are stored. There are 2 options in the menu:
- The first is to set up the Dashboard site.
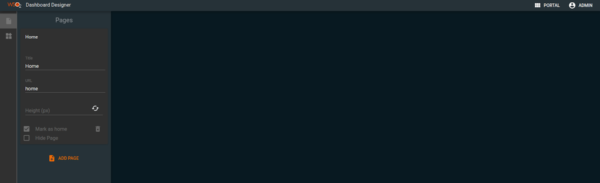
- The second is to add widgets.
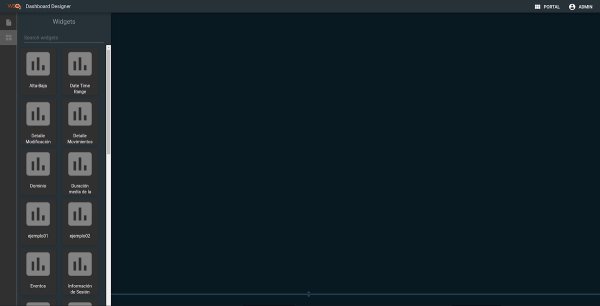
If you choose the widgets option, the components can simply be dragged into place on the workspace.
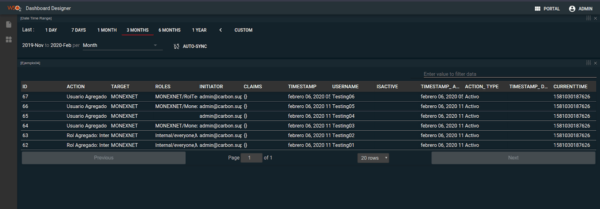
You can link them if the widget has entry parameters. For example, with DATE TIME in Analytics.