Today we’ll take a look at how to create a test lab for Gravitee’s API Management solution based on docker-compose with API-Key security. We’ll explore its various features from a practical point of view.
To do so, we’ll explore the following points:
1. Gravitee API Management definition
Gravitee API Management is an Open Source solution (Apache license 2.0) from the company Gravitee.io, that provides enterprise-grade support. For a comprehensive review of the product and its functionalities, take a look at the following article.
-This article may interest you: How to identify your organization’s API maturity level and requirements (chakray.com)-
2. Gravitee API Management architecture and components
Gravitee API Management is made up of four main components:
| API Management Gateway | responsible for the API execution runtime. It ensures compliance with security policies and manages the transformation of incoming and outgoing requests that pass through the Gateway (smart proxy). |
| API Management API | responsible for providing a central communication interface via a RESTful API for all administration tasks required by the product. It is consumed by the management console and the User Portal (Developer). |
| API Management Console | responsible for product administration and lifecycle management of the APIs deployed in the corresponding Gateways. User interface for Administration and API Publisher roles. |
| API Management Portal | responsible for providing application developers who consume APIs with an operations interface from which they can view API documentation, subscribe, and run tests. |
The following options are available as a persistence layer:
| Management | responsible for all data concerning the management of the product. MongoDB, Redis, or JDBC source connector may be used for this. |
| Rate Limit | responsible for all traffic control issues. MongoDB, Redis, or JDBC source connector may be used for this. |
| Analytics | responsible for the persistence of all analytics related issues (metrics, logs). Elasticsearch is the only option currently available. |
For our lab we’ll use MongoDB for traffic management and control and Elasticsearch for all things analytics related.
The architectural design of our laboratory will be as follows:
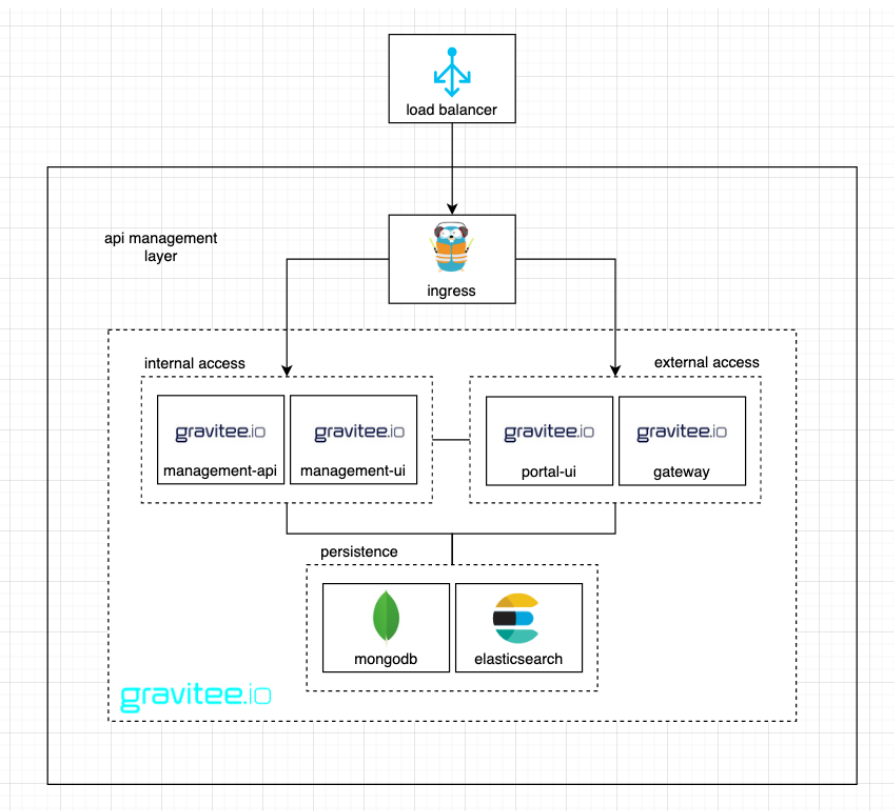
Figure 1. Architectural design
Access the laboratory’s source code via the following link https://github.com/ChakrayES/docker-compose-gravitee-api-singlegw (main branch).
3. Gravitee API Management test lab start up based on docker-compose with API-Key security
Before launching our lab services, we need to add the following lines to the machine’s local DNS file. For Linux or Mac environments, the configuration would be as follows:
/etc/hosts

127.0.0.1 portainer.demo.chakray.internal api.demo.chakray.internal mgt-api.demo.chakray.internal mgt-ui.demo.chakray.internal portal-ui.demo.chakray.internal
Alternatively, you can register the corresponding records within the local DNS Server, if this functionality is available on the LAN.
Once the DNS names have been registered, we will launch the laboratory by executing the following command in the project’s root directory:
docker-compose-gravitee-singlegw % docker-compose up -d
We can verify the status of the services using the following command:
docker-compose-gravitee-singlegw % docker-compose ps
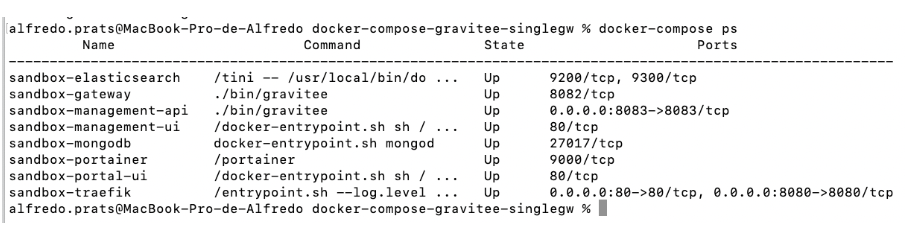
Figure 2. Service status
We can monitor the service logs using the following command:
docker-compose-gravitee-singlegw % docker-compose logs -f –tail 2
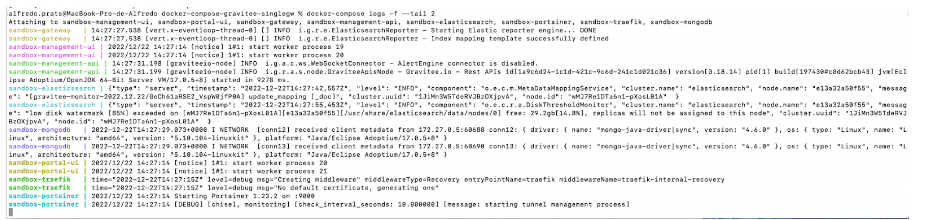
Figure 3. Service logs
3.1 Using Traefik Ingress to route traffic from the host machine to each of the containers
In order to route traffic from the host machine to each of the containers we’ve used Traefik Ingress on ports :80 and :8080 for traffic and the management console, respectively. However, as this is a laboratory environment, neither of the two components has been secured.
We can access the Traefik management console via the following link: http://localhost:8080
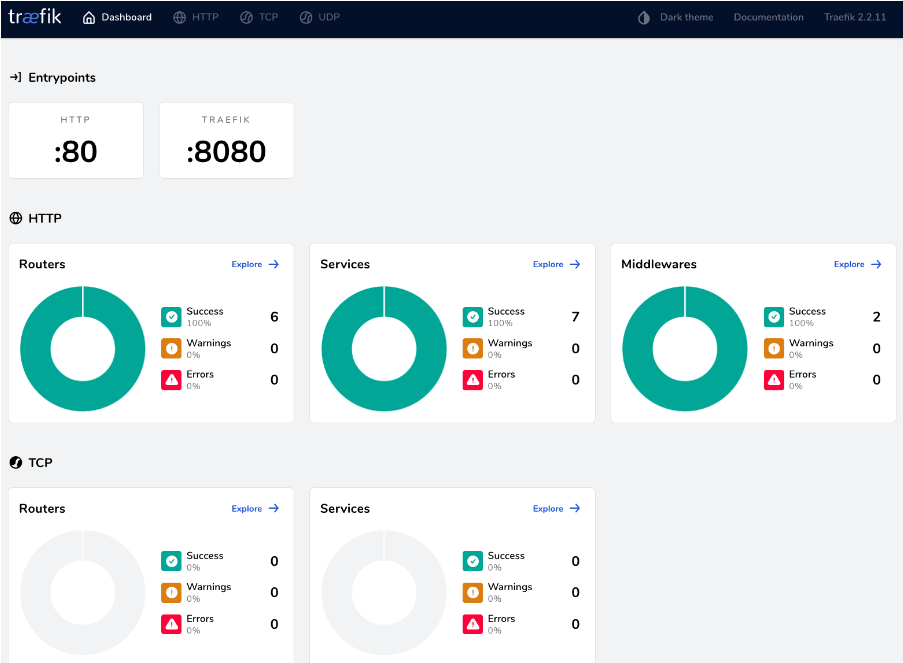
Figure 4. Traefik Console
In Traefik Ingress, each container has actively published its route using tags. By way of example, Gravitee API Management Gateway publishes its route as follows:
gateway:
    image: graviteeio/apim-gateway:3.18
    container_name: sandbox-gateway
    depends_on:
  	- mongodb
  	- elasticsearch
    environment:
  	- gravitee_management_mongodb_uri=mongodb://mongodb:27017/gravitee?serverSelectionTimeoutMS=5000&connectTimeoutMS=5000&socketTimeoutMS=5000
  	- gravitee_ratelimit_mongodb_uri=mongodb://mongodb:27017/gravitee?serverSelectionTimeoutMS=5000&connectTimeoutMS=5000&socketTimeoutMS=5000
  	- gravitee_reporters_elasticsearch_endpoints_0=http://elasticsearch:9200
    extra_hosts:
  	- "api.demo.chakray.internal:172.29.1.1"
  	- "mgt-am-api.demo.chakray.internal:172.29.1.1"
  	- "mgt-am-ui.demo.chakray.internal:172.29.1.1"
  	- "portal-ui.demo.chakray.internal:172.29.1.1"
    labels:
  	- "traefik.enable=true"
  	- "traefik.http.routers.api.rule=Host(`api.demo.chakray.internal`)"
  	- "traefik.http.routers.api.entrypoints=http"
  	- "traefik.http.routers.api.tls=false"
  	- "traefik.http.services.api.loadbalancer.server.port=8082"
    networks:
  	- sandbox-frontend-net
  	- sandbox-storage-net
As a result, all the traffic that reaches Traefik Ingress via the address “api.demo.chakray.internal” will be routed to the “gateway” container on port :8082.
In the Traefik management console, the route would appear as follows:
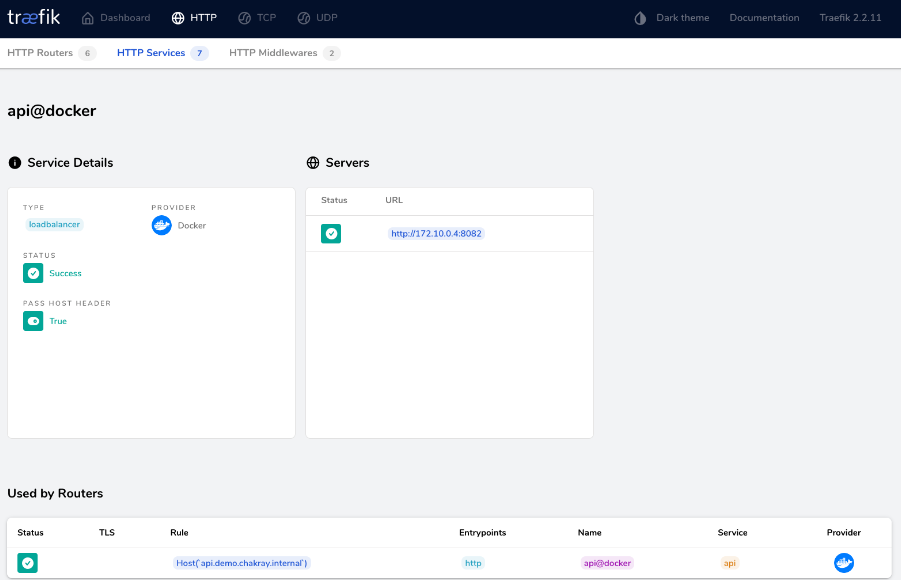
Figure 5. Traefik Management Console
In the same way, the Gravitee API Management console would be structured as follows:
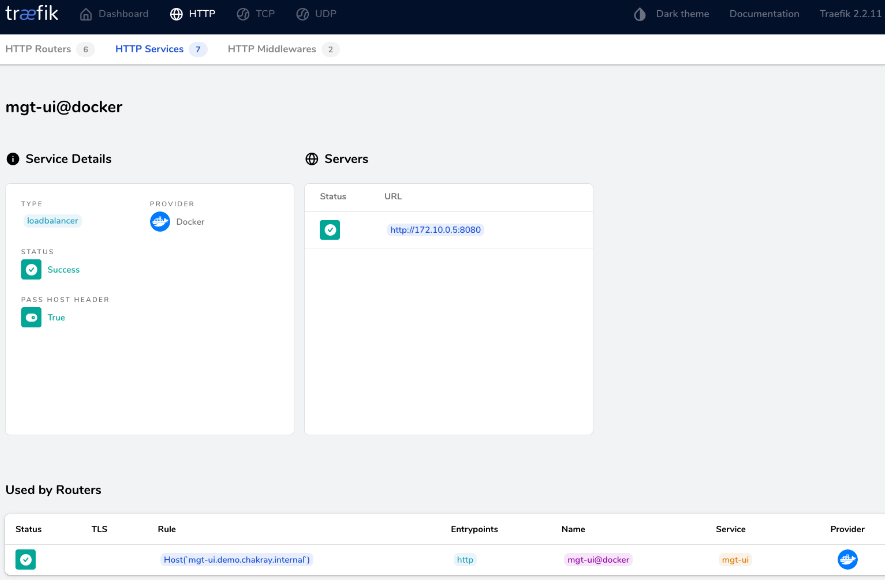
Figure 6. Gravitee API Management Console
This can be accessed via the following link: http://mgt-ui.demo.chakray.internal/
4. Publishing our first API with Gravitee API Management
We will use the following as an example of a backend service: https://restcountries.com/. The aim is to access this service using our API Management layer, enhance security by means of an API-Key and access consumption analytics.
4.1 Creating the API definition
In this section we’ll explain how to create an API definition using the console.
1.Log in to the management console and open the “APIs” menu, add a new one by clicking on the “+” button in the bottom right hand corner.
Figure 7. Creating the API definition
2. Click the “Continue in the wizard” option.
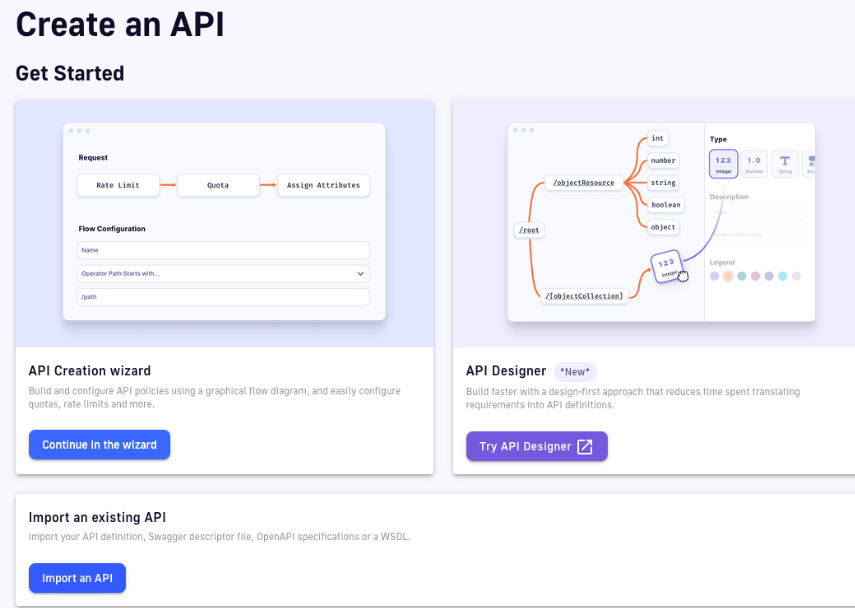
Figure 8. API creation process
3. Enter the name, version, description, and context of the API we would like to configure.
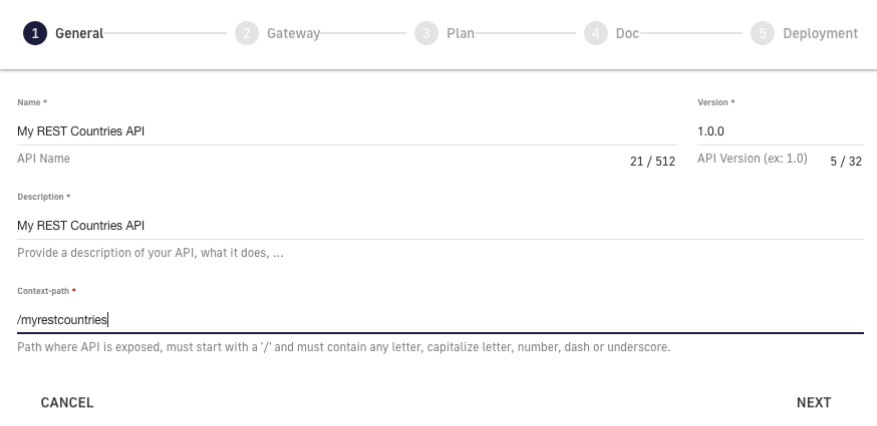
Figure 9. Complete fields
4. Define the backend to which incoming requests will be redirected in our Gateway. In this case, the backend service will be https://restcountries.com/v3.1/.
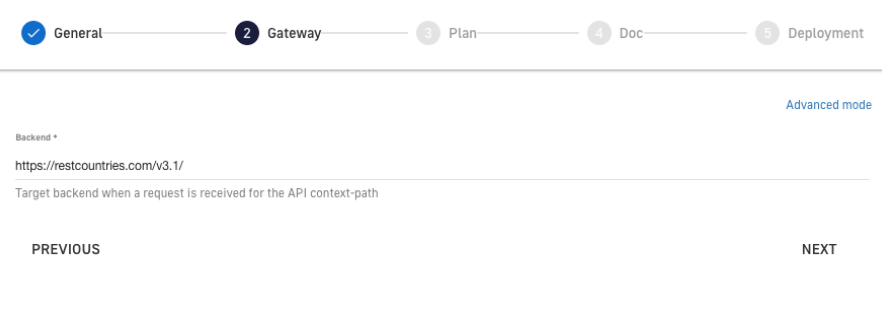
Figure 10. Gateway Requests
5. Define the consumption plan, in our case it will be “api-key”. Later, we will be able to add more consumption plans to our API. If necessary, define the limits of consumption and resources required.
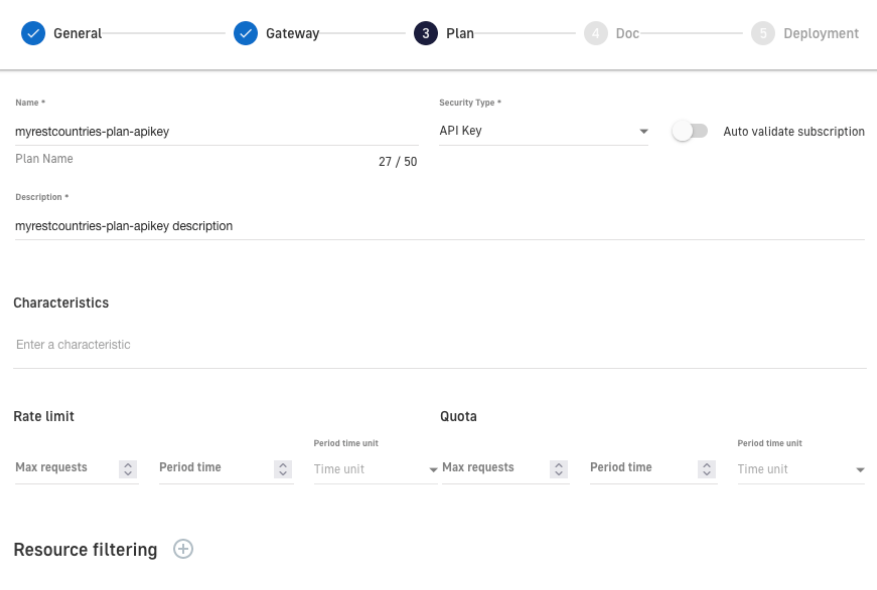
Figure 11. Consumption plan
6. Add all available API documentation. This documentation can be supplemented at a later stage by adding new content.
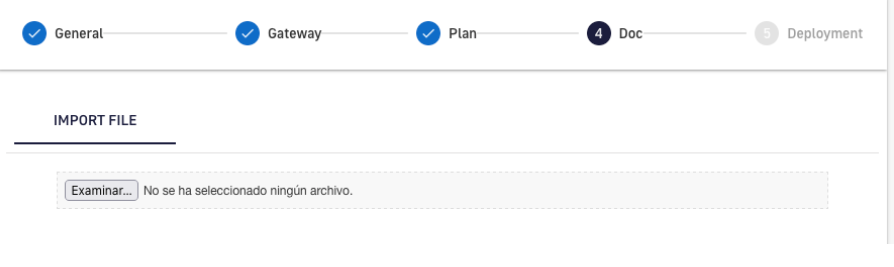
Figure 12. Add information
7. Now, we can create our API and deploy it in the Gateway by selecting the “Create and start the API” option .
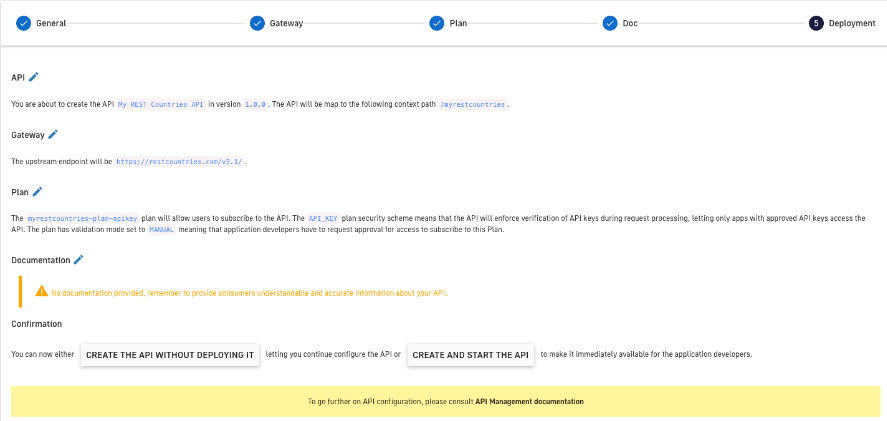
Figure 13. Activate API
8. If everything has been done correctly, we can view our API in the management console catalog.
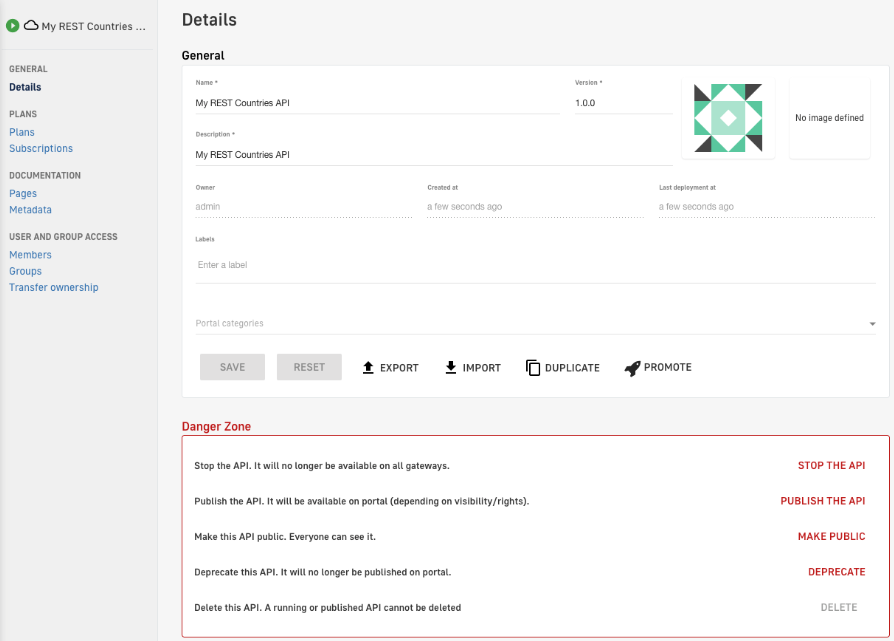
Figure 14. View API
4.2 Subscribe and obtain an API-KEY
After creating the API, we need to subscribe to one of the plans created in order to be able to use it (unless there is a keyless plan, which allows its use publicly). To do so, go to the “Subscriptions” menu of our API and click the “+”button.
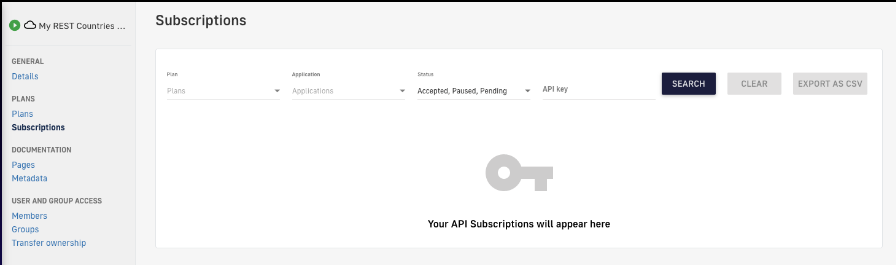
Figure 15. Subscriptions
Select one of the available applications and the plan you wish to subscribe to.
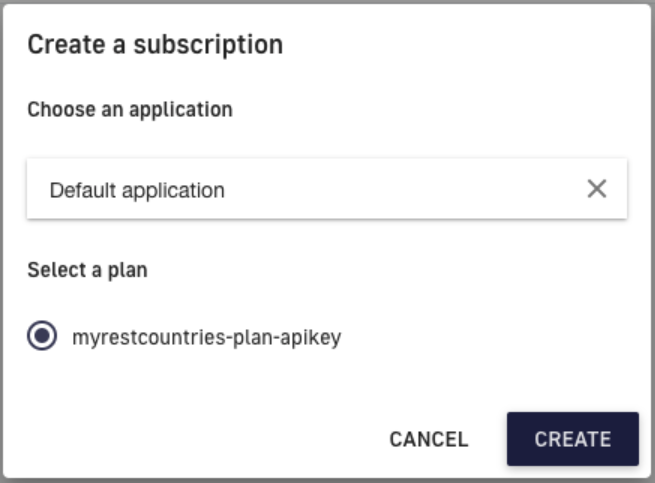
Figure 16. Create a subscription
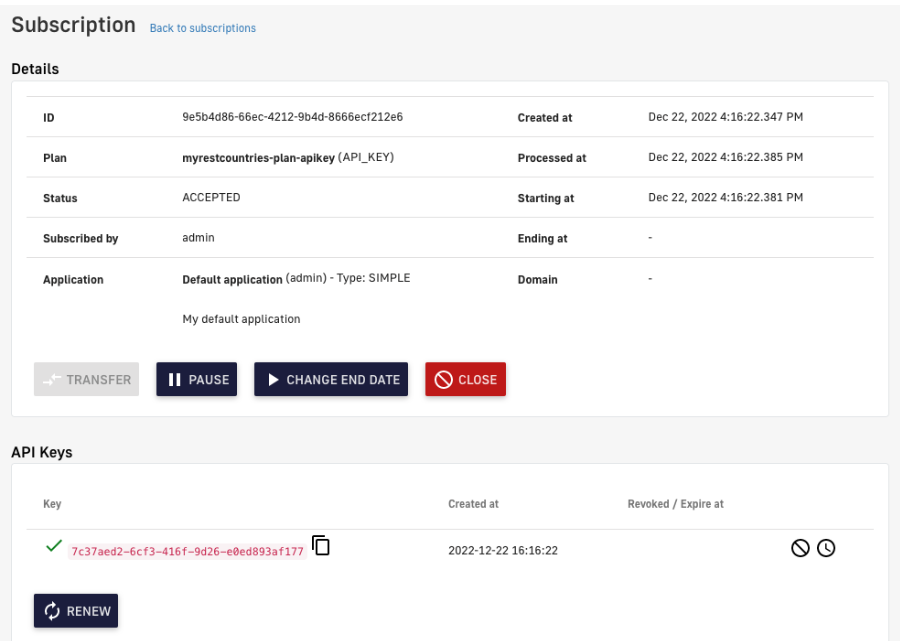
Figure 17. Subscription details
By doing so, we’ll obtain an API-Key that we can use to consume our API. In this case: 7c37aed2-6cf3-416f-9d26-e0ed893af177
4.3 Consuming our secure API using an API-key
To consume our secure API using an API-Key, we will use the following curl command:
curl \

  -H 'X-Gravitee-Api-Key: 7c37aed2-6cf3-416f-9d26-e0ed893af177' \

  "http://api.demo.chakray.internal/myrestcountries/alpha/es" | jq
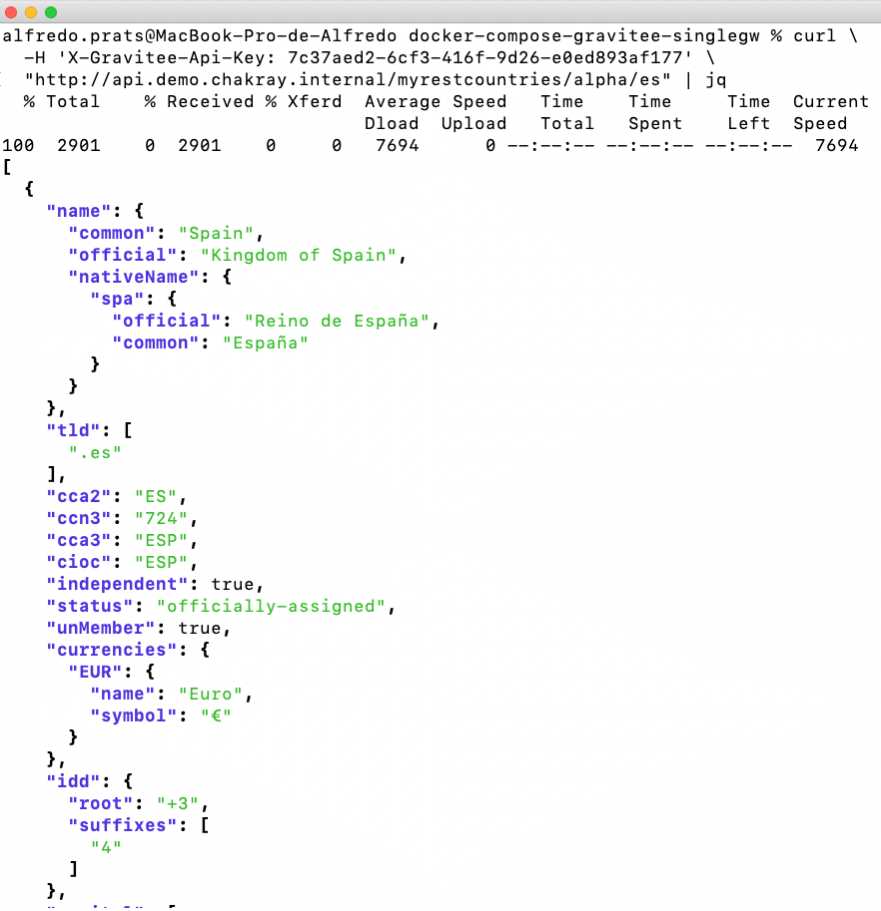
Figure 18. Consuming APIs using an API-Key
4.3.1 API consumption analytics
To access our API analytics we have to open to the “Analytics” menu of our API.
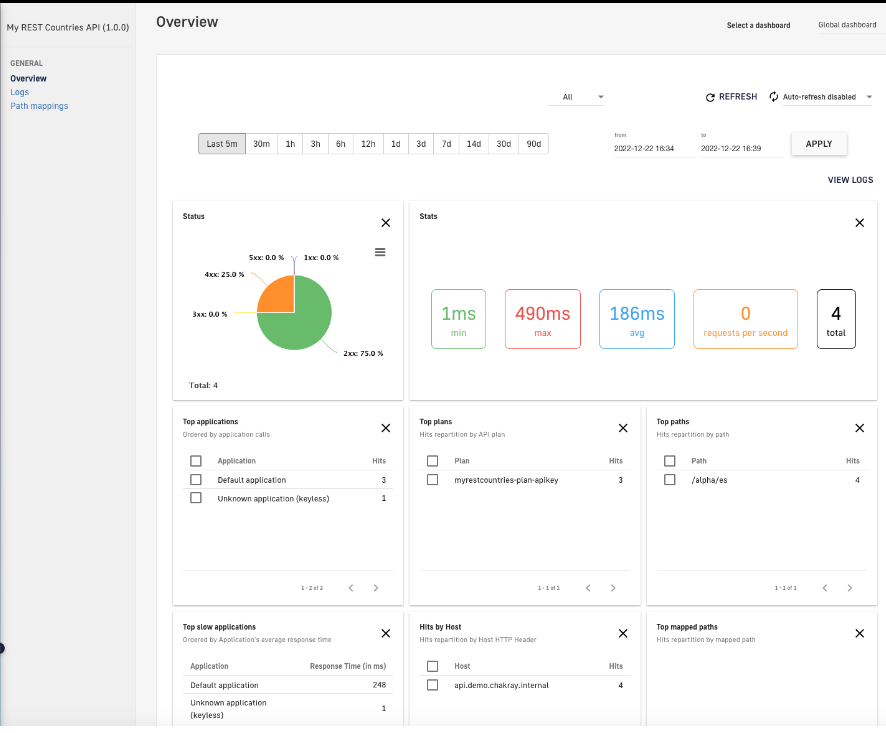
Figure 19. Analytics of our API
From this dashboard we can check the number of requests based on different criteria: application, plan, path. In addition, there is a summary available based on the response code of our API (http status code) and the various consumption rates.
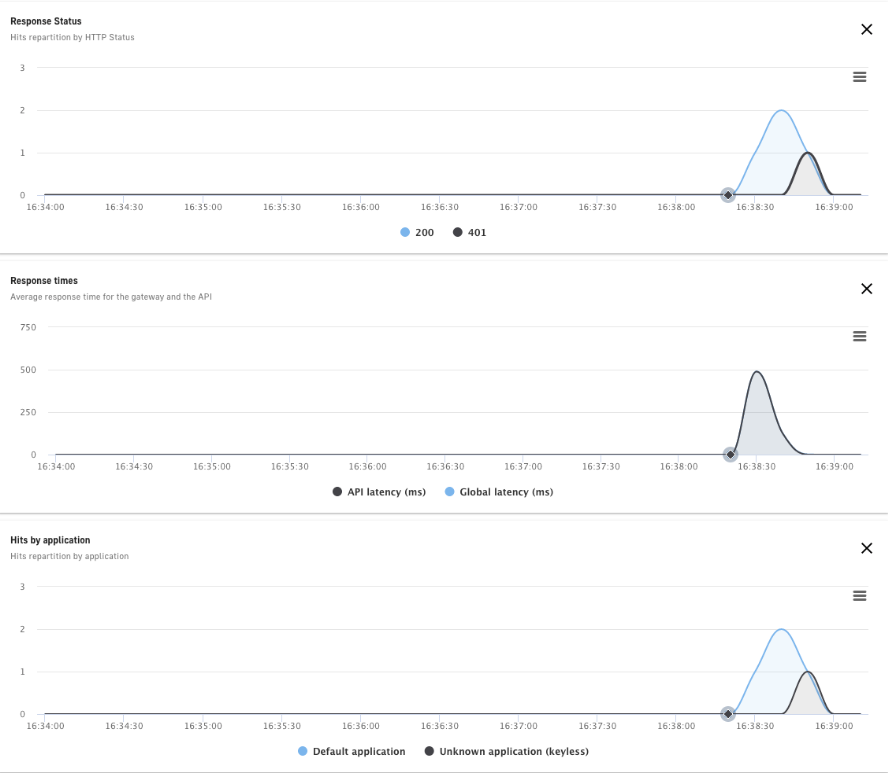
Figure 20. Dashboard
4.3.2 Accessing our API logs
To access our API logs we need to open the “Analytics” menu of our API. Here, we can access the “Logs” sub-menu.
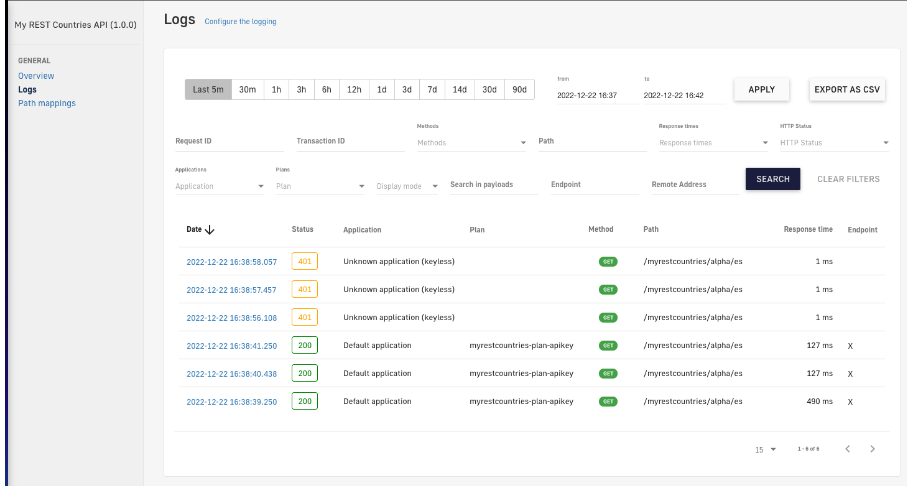
Figure 21. Logs
When we open a specific log registry, we are presented with a condensed version of the logs. In this condensed version we won’t be able to access the headers or the body of the requests themselves.
To access an extended version of the logs, we need to configure our API using the “Configure the logging” option . We shall enable the desired options and save the changes.
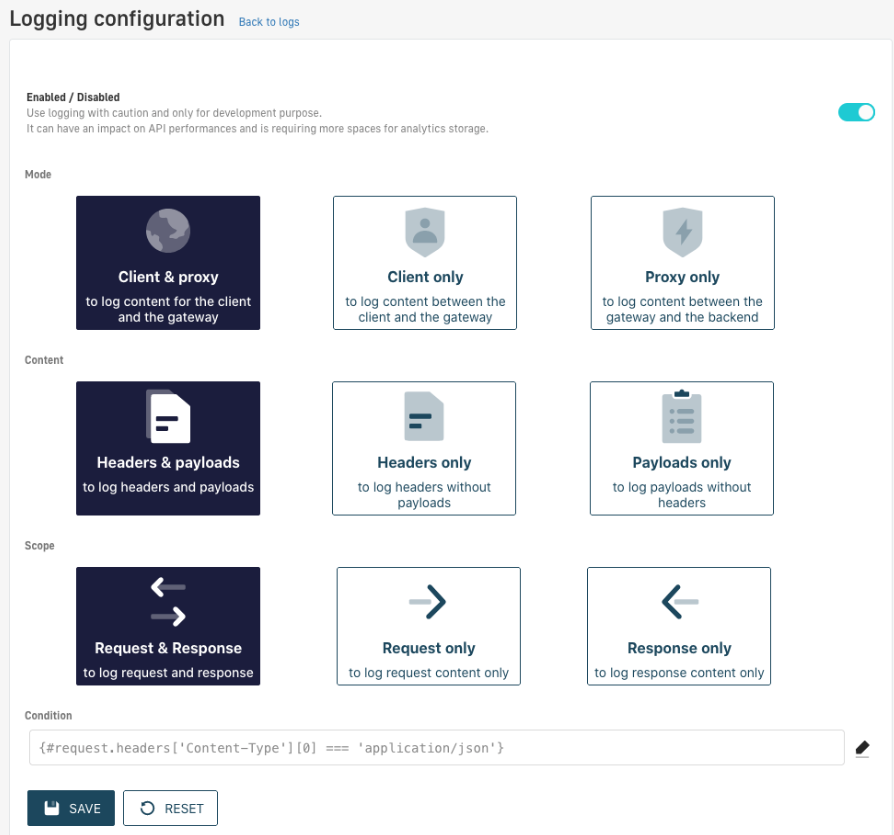
Figure 22. Logging Configuration
When we open one of the log registries, we will now be shown an extended version of them, allowing us to view both the headers and the body of the requests in full.
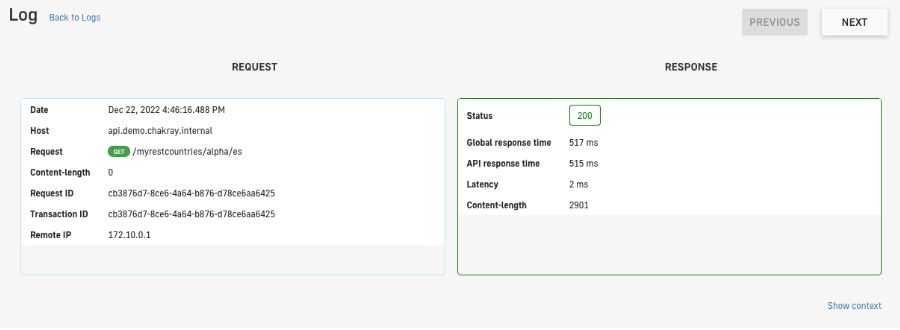
Figure 23. Registry
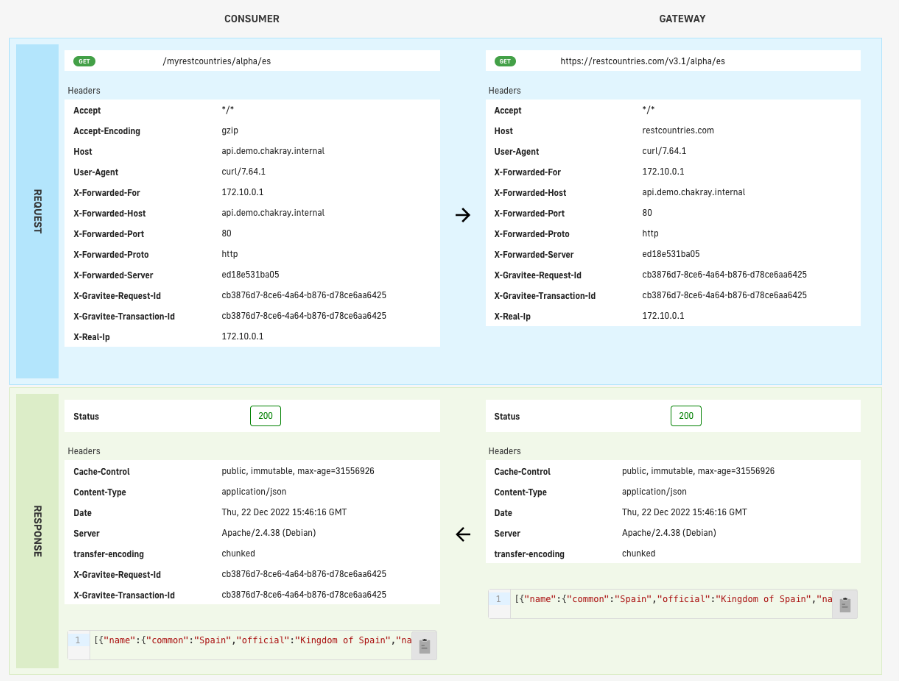
Figure 24. Specific registry
5. Chakray & Gravitee
As an official Gravitee.io Partner, Chakray has the all necessary knowledge and tools to tackle any API Management project, thus providing the peace of mind of having a team specialized in deployment, development and subsequent maintenance, not to mention manufacturer support for Enterprise environments. We’ll be more than happy to discuss your use case and explore the best APIfication strategy for implementing an API Management layer within your company. Contact us today!