
In this modern world, the development of applications covers more aspects than mere code instrumentation. It involves the deployment of tasks through continuous integration or the control of its use and/or condition through monitoring, especially in the creation and maintenance of microservices.
Focusing on the latter, WSO2 provides us with the Analytics profile integrated into the EI, through which we can gather usage statistics of each deployed device, or obtain their tracing. This will help optimize the efficiency and latency of our services, improve error tracing, and support distribution transaction monitoring.
Now, as an improvement on version 6.6.0, we can connect WSO2 EI to other monitoring and observability tracing tools which are not Analytics, namely: Jaeger.
1. What is Jaeger and how can we connect it with WSO2 EI
Jaeger is a tool which will help us with application monitoring by means of traceability. Its greatest advantage is its adaptation to the OpenTracing model.
To see their simultaneous functioning, let’s take a look at a simple example by means of an API dummy. We’ll lead you through making an API call, several intermediaries will be executed, and a response will be returned. Both the WSO2 EI and Jaeger can easily be deployed through, for example, a docker-compose.
By default, WSO2 EI is not prepared to send information. For this reason, you will have to modify the synapse.properties file before initiating it. You must modify it in order to activate the sending of tracing data.
mediation.flow.statistics.tracer.collect.payloads=true
mediation.flow.statistics.tracer.collect.properties=true
mediation.flow.statistics.collect.all=true
By doing this, you indicate that the sending of message information as well as its context and transport properties are permitted. This also enables the sending of this information for all devices. You will also have to configure the same file to indicate where the information should be sent to. Its default setting is Analytics.
opentracing.enable=true
jaeger.sampler.manager.host=localhost
jaeger.sampler.manager.port=5778
jaeger.sender.agent.host=localhost
jaeger.sender.agent.port=6831
jaeger.reporter.log.spans=true
jaeger.reporter.max.queue.size=1
jaeger.reporter.flush.interval=10000
1.1 Building API
1.1.1 Step one
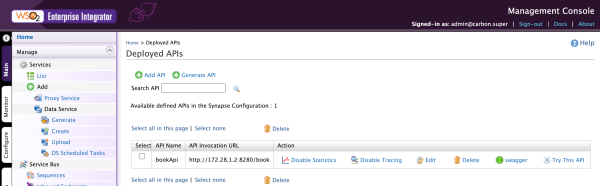
Once both products are started, you are going to build a probationary API. It will be something simple with several intermediaries. Once created, click on the enable tracing option. By doing this, each time you call an API method, information will be sent to Jaeger from WSO2 ESB
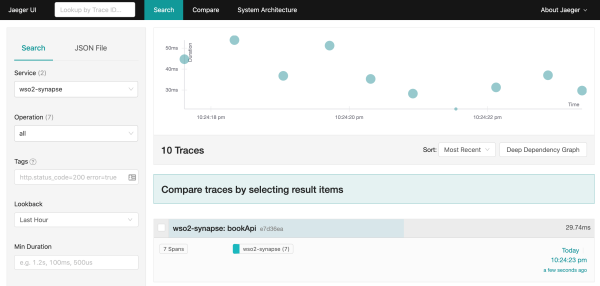
For this, access http://localhost:16686 and search for the wso2-synapse service. There, all the calls made to WSO2 will be displayed.
1.1.2 Step two
On this panel you can view, filter, or order the calls made. By clicking on each one of them, you will get a closer view of each call.
1.1.3 Step three
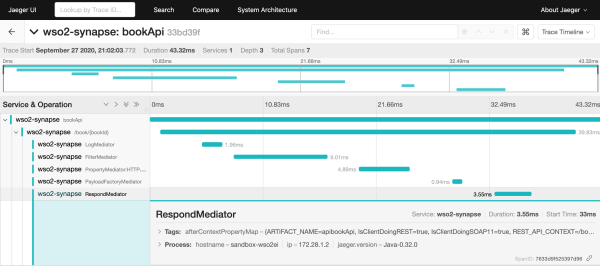
It will show the processing time, the elements which have internally intervened, and how the properties and the message have been affected by these elements. All this information will help to improve your current and future application performance analyses.
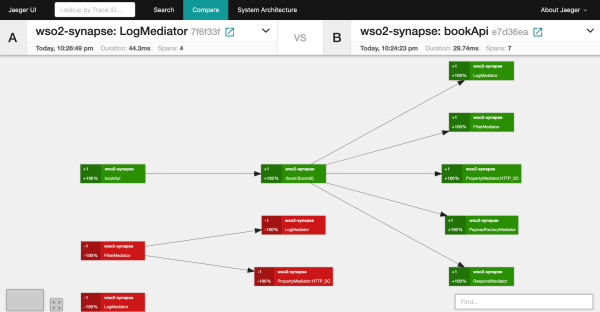
Furthermore, different traces can be selected and compared:
2. CONCLUSION
As you can see, Jaeger is a simple but useful tool for development and maintenance. It can be easily connected to the WSO2 ecosystem.