
In this tutorial, we will explain how to create custom widgets in WSO2 API Manager Analytics. To do so, we will start by explaining what widgets are in WSO2 and the prerequisites needed to create them, before reaching a conclusion. Let’s get started!
What are widgets in WSO2?
A widget in the WSO2 API Manager Analytics portal is a ReactJS component that can be used to visualise information. A widget may be used for static or interactive visualisations, such as graphs, tables, filters, etc.
In addition to the widgets that are available on analytics dashboards, custom widgets can be implemented and subsequently used on all dashboards.
WSO2 API Manager Analytics has a widget generator tool to automatically create the widget structure.
Prerequisites for custom widgets in WSO2
In order to carry out this exercise, the following components must be installed:
- WSO2 API Manager 3.1
- WSO2 APIM Analytics 3.1
- npm
Steps required to create custom widgets in WSO2 API Manager Analytics
The steps to follow when creating a custom widget are as follows:
1. Create the new widget project
1.1 In the API Manager Analytics installation folder, we must go to the following path:
<API-M_ANALYTICS_HOME>/wso2/tools/generator-widget
1.2 In order to launch the widget generator tool, we must run the following command:
npm run init
Once the command has been executed, the following output will be displayed:
> generator-widget@1.0.0 init /home/chakray/wso2am-analytics-3.1.0/wso2/tools/generator-widget
> npm i && npm link

audited 729 packages in 2.356s

13 packages are looking for funding
  run `npm fund` for details

found 0 vulnerabilities

audited 729 packages in 2.174s

13 packages are looking for funding
  run `npm fund` for details

found 0 vulnerabilities

/usr/local/lib/node_modules/generator-widget -> /home/chakray/wso2am-analytics-3.1.0/wso2/tools/generator-widget
1.3 After that, we must execute the following command in order to generate the widget project:
npm run createwidget--widgettype:subscriber--dataprovider:SiddhiDataProvider
The tool will prompt us to enter the widget name and the widget header.
For the purposes of this example, we will use the following data:
| Widget Name | APIMSampleWidget |
| Widget Heading | APISampleWidget |
Once the requested data has been entered, project construction will begin.
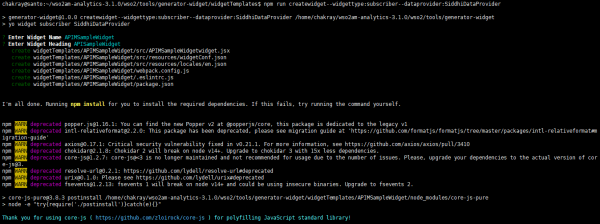
When the process is complete, the following file structure will be generated:
APIMSampleWidget
├── src
│   ├── resources
│   │     └──widgetConf.json
│   └── APIMSampleWidgetwidget.jsx
├── package.json
└── webpack.config.js
Where:
package.json
The package.json file contains metadata relevant to the widget. This file is used to provide information to npm and enables it to identify the widget and deal with dependencies.
widgetConf.json
Contains the widget meta information, such as the widget ID, widget name and settings.
webpack.config.js
webpack.config.js is essentially used to configure the entry point and the output results directory of the widget.
1.4 Next, we must launch a node development environment and create a symbolic link (Symlink). In order to do this we must execute the following command:
npm run dev
Once execution is complete, a symbolic link from the directory will be created
<ANALYTICS_HOME>wso2/tools/generator-widget/widgetTemplates
to the directory
<ANALYTICS_HOME>/wso2/dashboard/deployment/web-ui-apps/analytics-dashboard/extensions/widgets
NOTE: The creation of a development environment and the symbolic link will immediately update the changes in the analytics portal. This means it is no longer necessary to restart the dashboard service in order to see the changes.
2. Define database settings for the widget
2.1 In order to define the DB settings, we must edit the APIMSampleWidgetwidget.jsx file, is located in the following path: <ANALYTICS_HOME>/wso2/tools/generator-widget/widgetTemplates/APIMSampleWidget/src/resources
For the purposes of this example, we will execute a query against the AM_API table.
2.2 We replace the existing code with the following example code, which will help us to generate the table.
{
  "name": "APIM Sample Widget",
  "id": "APIMSampleWidget",
  "thumbnailURL": "",
  "configs": {
    "pubsub": {
      "types": ["subscriber"]
    },
    "providerConfig" : {
      "configs": {
        "type": "RDBMSStreamingDataProvider",
        "config": {
          "datasourceName": "AM_DB",
          "queryData": {
            "apiusagequery": "select * from AM_API"
          },
          "publishingInterval": 360000,
          "tableName": "AM_API",
          "publishingLimit": 2147483647,
          "isPurgingEnable": false
        }
      }
    },
    "options": [
      {
        "id": "header",
        "title": "Header",
        "type": {
          "name": "BOOLEAN",
          "possibleValues": [
            true,
            false
          ]
        },
        "defaultValue": true
      },
      {
        "id": "headerTitle",
        "title": "Widget Title",
        "type": {
          "name": "TEXT"
        },
        "defaultValue": "Demo Telefonica"
      },
      {
        "id": "drillDown",
        "title": "Subscription Analytics Page",
        "type": {
          "name": "TEXT"
        },
        "defaultValue": ""
      }
    ]
  }
}
2.3 Lastly, we save the file.
NOTE:
- The data providers are the sources from which information is obtained for display in widgets. Both SiddhiStoreDataProvider or RDBMSDataProvider can be used for said purposes. More information on data providers can be found at the following link.
- In order to retrieve data, a Siddhi application and a Siddhi query must be created. More information can be found at the following link.
3. Create a graph to display the data
In order to display the query data, we must use a graph. For the purposes of this example we will use a table. There is a library called React-VizGrammar containing numerous examples of graphs which you can check out at the following link.
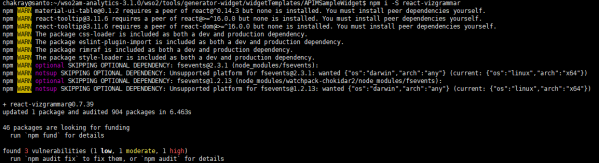
3.1 In order to use this library, we must first install it in the path <ANALYTICS_HOME>/wso2/tools/generator-widget/widgetTemplates/APIMSampleWidget using the following command:
npm i -S react-vizgrammar
3.2 Once installed, we must edit the widgetConf.json file, which is located in the following path: <ANALYTICS_HOME>/wso2/tools/generator-widget/widgetTemplates/APIMSampleWidget/src
3.3 We then replace the existing code with the following example code, which will help us to generate the table.
/*
 * Copyright (c) 2018, WSO2 Inc. (http://www.wso2.org) All Rights Reserved.
 *
 * WSO2 Inc. licenses this file to you under the Apache License,
 * Version 2.0 (the "License"); you may not use this file except
 * in compliance with the License.
 * You may obtain a copy of the License at
 *
 * http://www.apache.org/licenses/LICENSE-2.0
 *
 * Unless required by applicable law or agreed to in writing,
 * software distributed under the License is distributed on an
 * "AS IS" BASIS, WITHOUT WARRANTIES OR CONDITIONS OF ANY
 * KIND, either express or implied.  See the License for the
 * specific language governing permissions and limitations
 * under the License.
 */

import Widget from "@wso2-dashboards/widget";
import VizG from 'react-vizgrammar';
import {Scrollbars} from 'react-custom-scrollbars';
import {darkBaseTheme, getMuiTheme, MuiThemeProvider} from 'material-ui/styles';
import moment from 'moment';


const totalPages = (Math.random() * 100).toFixed(0);

const requestData = (pageSize, page) => {
    // This is a mock service to emulate an endpoint you can use any kind of endpoint to fetch data.
    return new Promise((resolve, reject) => {
        const res = {
            data: makeDataWithSize(pageSize),
            pages: totalPages,
        };

        setTimeout(() => resolve(res), 500);
    });
}

class APIMSampleWidget extends Widget {
constructor(props) {
            super(props);

        this.state = {
            data: [["","","",""]],
            pageSize: -1,
        };

        this.normalTableConfig = {
            charts: [
                {
                    type: 'table',
                    columns: [
                        {
                            name: 'apiname',
                            title: 'API NAME',
                        },
                        {
                            name: 'apiversion',
                            title: 'API VERSION',
                        },
                        {
                            name: 'context',
                            title: 'CONTEXT',
                        },
                        {
                            name: 'createdby',
                            title: 'CREATED BY',
                        },
                    ],
                },
            ],
            pagination: true,
            filterable: true,
            append: false,
            sortable: false
        };

            this.normalDataSetMetadata = {
            names: ['apiname','apiversion','context','createdby'],
            types: ['ordinal','ordinal','ordinal','ordinal'],
        };

        }


        render() {
           const { usageData } = this.state;
            return (
                <VizG config={this.normalTableConfig} metadata={this.normalDataSetMetadata} data={this.state.data}/>
            );
        }
}


global.dashboard.registerWidget('APIMSampleWidget', APIMSampleWidget);
3.4 We save the file.
3.5 Finally, to build the widget with the new changes we execute the following command:
npm run build
4. Deploy the widget in a new dashboard
4.1 In order to deploy the widget that we have just created, we must first create a new dashboard. This will be carried out in the analytics portal which we will access via the following url:
https://localhost:9643/analytics-dashboard/
4.2 Once inside the analytics portal, we must click on the Create Dashboard button.
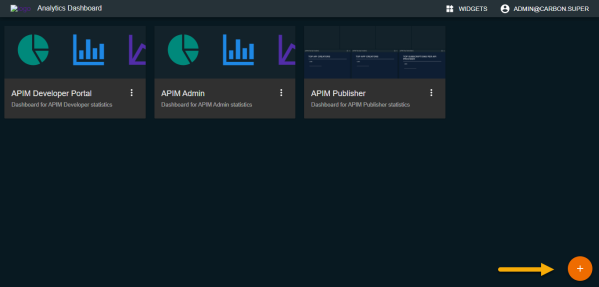
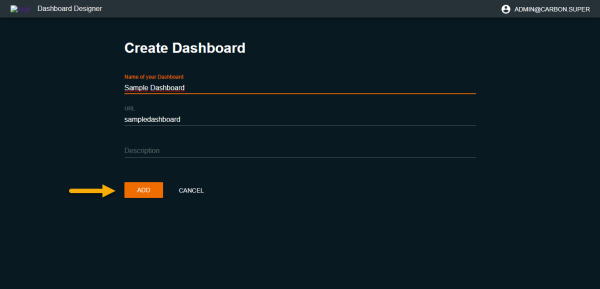
4.3 In the next window we must enter the name of our dashboard. For the purposes of this example, we will use the name Sample Dashboard. In order to continue, we click on the ‘ADD’ button.
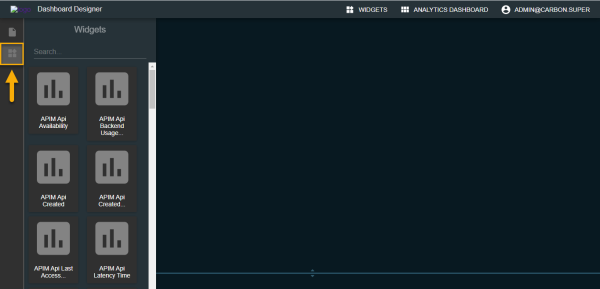
4.4 In order to add our widget we must click on the widget button, as shown in the following image.
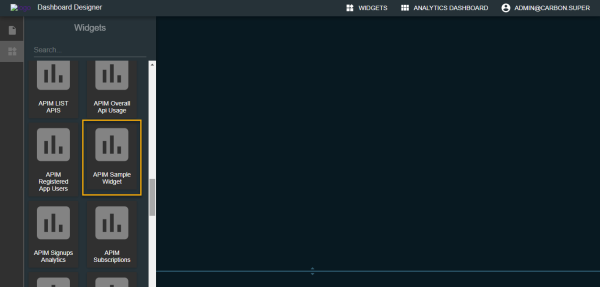
4.5 With the help of scroll, we will search by the name assigned to our widget. For the purposes of this example, it is called APIM Sample Widget.
4.6 Once the widget has been added, it is displayed as follows:
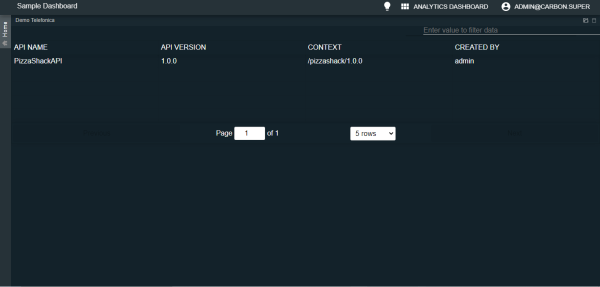
Our new widget is now available for use on any dashboard.
Conclusions
As this example shows, the custom widgets in WSO2 API Manager Analytics 3.1 are extremely useful. They enable us to make use of the information stored in the WSO2 API Manager Analytics tables and to use various graphs to present said data.
References
- React-VizGrammar: https://wso2.github.io/react-vizgrammar/#/samples
- Working with Data Providers: https://docs.wso2.com/display/SP440/Working+with+Data+Providers#WorkingwithDataProviders-SiddhiStoreDataProvider